

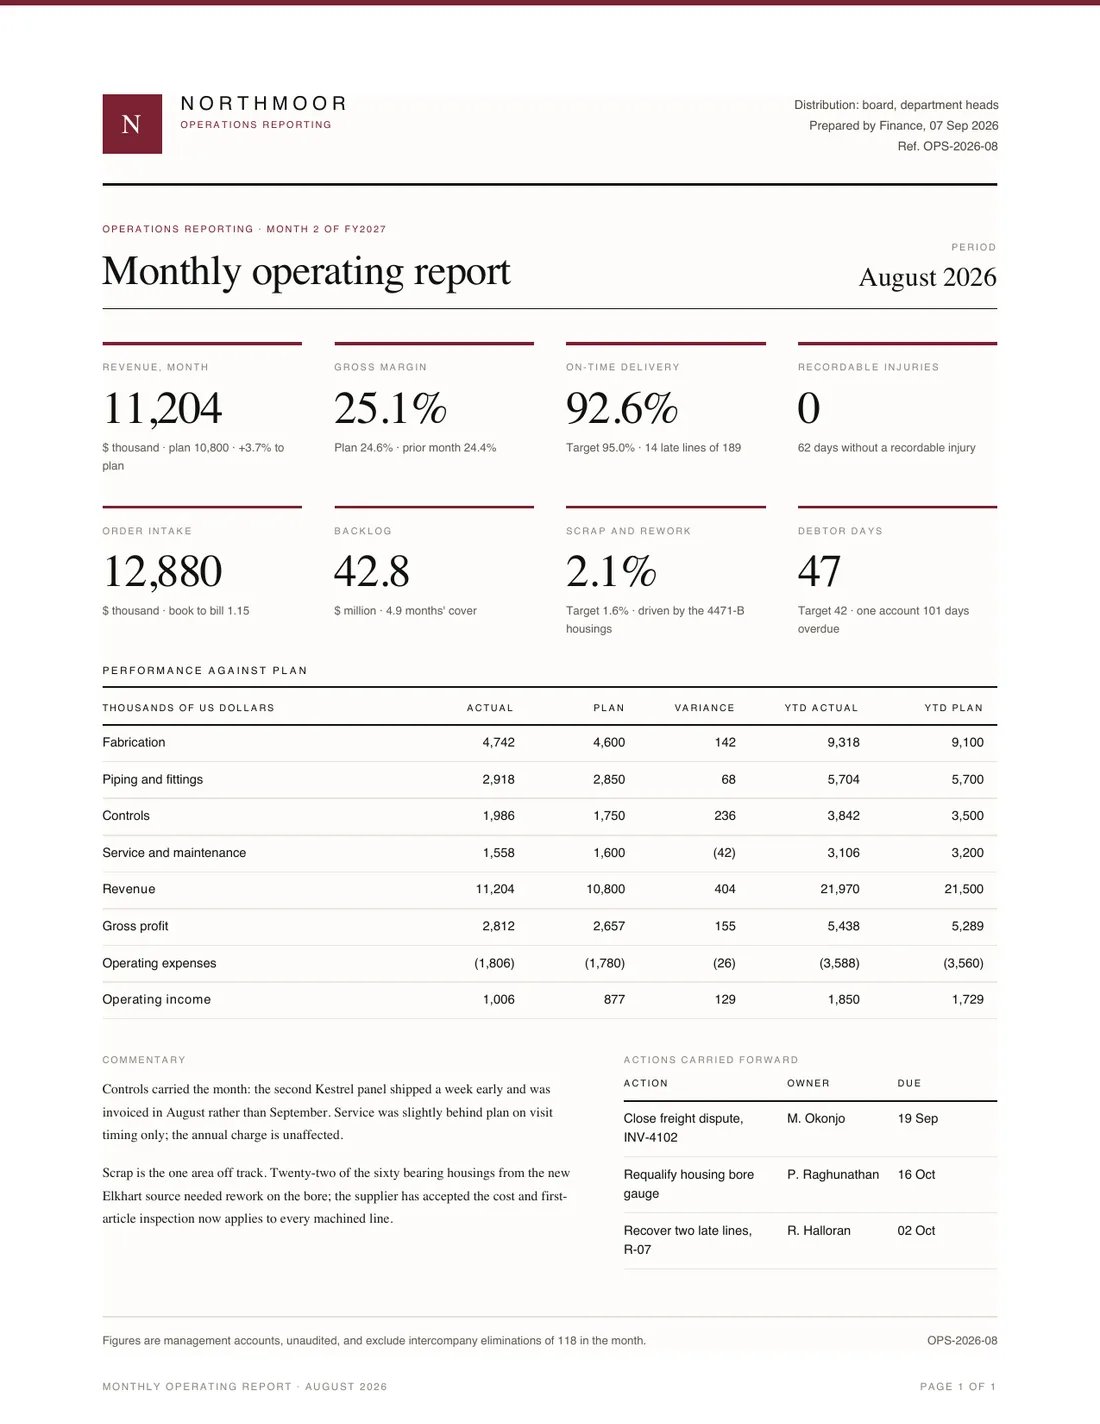
Monthly Report — rendered output
data.json first; segment rows must sum to the revenue row. The KPI figures use the accent keyline treatment; nothing else on the page is coloured.
Engine features exercised: CSS grid KPI rows, grouped-subtotal table rows, flex column split with explicit percentage widths, single-page fill with footer push.
Render it:
npx @formepdf/html templates/report-monthly/index.html -o report-monthly.pdf
<!DOCTYPE html>
<html lang="en">
<head>
<meta charset="utf-8">
<title>Monthly operating report — August 2026 — Northmoor Industrial Group, Inc.</title>
<link rel="stylesheet" href="../northmoor-shared.css">
<link rel="stylesheet" href="style.css">
</head>
<body>
<div class="sheet">
<div class="pagefill">

<header>
<div class="atop"></div>
  <div class="hd">
    <div class="mast-left">
      <div class="mark">N</div>
      <div>
        <div class="wm">Northmoor</div>
        <div class="sub" style="margin-top: 3pt">Operations Reporting</div>
      </div>
    </div>
    <div class="addr" style="text-align: right">Distribution: board, department heads<br>Prepared by Finance, 07 Sep 2026<br>Ref. OPS-2026-08</div>
  </div>
  <div class="hr2" style="margin-top: 15pt"></div>
  <div class="dochead">
    <div>
      <div class="lbl lbl-accent" style="margin-bottom: 7.5pt">Operations reporting · month 2 of FY2027</div>
      <h1 class="dtitle">Monthly operating report</h1>
    </div>
    <div style="text-align: right">
      <div class="lbl" style="margin-bottom: 5.25pt">Period</div>
      <div class="refnum">August 2026</div>
    </div>
  </div>
</header>

<div class="kpigrid">
  <div class="kpi"><div class="lbl">Revenue, month</div><div class="v">11,204</div><div class="d">$ thousand · plan 10,800 · +3.7% to plan</div></div>
  <div class="kpi"><div class="lbl">Gross margin</div><div class="v">25.1%</div><div class="d">Plan 24.6% · prior month 24.4%</div></div>
  <div class="kpi"><div class="lbl">On-time delivery</div><div class="v">92.6%</div><div class="d">Target 95.0% · 14 late lines of 189</div></div>
  <div class="kpi"><div class="lbl">Recordable injuries</div><div class="v">0</div><div class="d">62 days without a recordable injury</div></div>
</div>
<div class="kpigrid kpigrid-2">
  <div class="kpi"><div class="lbl">Order intake</div><div class="v">12,880</div><div class="d">$ thousand · book to bill 1.15</div></div>
  <div class="kpi"><div class="lbl">Backlog</div><div class="v">42.8</div><div class="d">$ million · 4.9 months' cover</div></div>
  <div class="kpi"><div class="lbl">Scrap and rework</div><div class="v">2.1%</div><div class="d">Target 1.6% · driven by the 4471-B housings</div></div>
  <div class="kpi"><div class="lbl">Debtor days</div><div class="v">47</div><div class="d">Target 42 · one account 101 days overdue</div></div>
</div>

<h2 class="sh">Performance against plan</h2>
<table class="t perf">
  <thead><tr><th scope="col">Thousands of US dollars</th><th scope="col" class="num">Actual</th><th scope="col" class="num">Plan</th><th scope="col" class="num">Variance</th><th scope="col" class="num numw">YTD actual</th><th scope="col" class="num numw">YTD plan</th></tr></thead>
  <tbody>
    <tr><td>Fabrication</td><td class="num">4,742</td><td class="num">4,600</td><td class="num">142</td><td class="num">9,318</td><td class="num">9,100</td></tr>
    <tr><td>Piping and fittings</td><td class="num">2,918</td><td class="num">2,850</td><td class="num">68</td><td class="num">5,704</td><td class="num">5,700</td></tr>
    <tr><td>Controls</td><td class="num">1,986</td><td class="num">1,750</td><td class="num">236</td><td class="num">3,842</td><td class="num">3,500</td></tr>
    <tr><td>Service and maintenance</td><td class="num">1,558</td><td class="num">1,600</td><td class="num">(42)</td><td class="num">3,106</td><td class="num">3,200</td></tr>
    <tr class="gsub"><td>Revenue</td><td class="num">11,204</td><td class="num">10,800</td><td class="num">404</td><td class="num">21,970</td><td class="num">21,500</td></tr>
    <tr><td>Gross profit</td><td class="num">2,812</td><td class="num">2,657</td><td class="num">155</td><td class="num">5,438</td><td class="num">5,289</td></tr>
    <tr><td>Operating expenses</td><td class="num">(1,806)</td><td class="num">(1,780)</td><td class="num">(26)</td><td class="num">(3,588)</td><td class="num">(3,560)</td></tr>
    <tr class="gsub"><td>Operating income</td><td class="num">1,006</td><td class="num">877</td><td class="num">129</td><td class="num">1,850</td><td class="num">1,729</td></tr>
  </tbody>
</table>

<div class="bottomcols">
  <div class="commentary">
    <div class="lbl" style="margin-bottom: 6pt">Commentary</div>
    <div class="prose" style="font-size: 7.5pt"><p>Controls carried the month: the second Kestrel panel shipped a week early and was invoiced in August rather than September. Service was slightly behind plan on visit timing only; the annual charge is unaffected.</p><p>Scrap is the one area off track. Twenty-two of the sixty bearing housings from the new Elkhart source needed rework on the bore; the supplier has accepted the cost and first-article inspection now applies to every machined line.</p></div>
  </div>
  <div class="actions">
    <div class="lbl" style="margin-bottom: 6pt">Actions carried forward</div>
    <table class="t small-t">
      <thead><tr><th scope="col">Action</th><th scope="col" style="width: 61.5pt">Owner</th><th scope="col" style="width: 55.5pt">Due</th></tr></thead>
      <tbody>
        <tr><td>Close freight dispute, INV-4102</td><td>M. Okonjo</td><td>19 Sep</td></tr>
        <tr><td>Requalify housing bore gauge</td><td>P. Raghunathan</td><td>16 Oct</td></tr>
        <tr><td>Recover two late lines, R-07</td><td>R. Halloran</td><td>02 Oct</td></tr>
      </tbody>
    </table>
  </div>
</div>

<div class="pagefill-spacer"></div>
<footer class="foot">
  <div style="flex: 1">Figures are management accounts, unaudited, and exclude intercompany eliminations of 118 in the month.</div>
  <div>OPS-2026-08</div>
</footer>

</div>
</div>
</body>
</html>
/* report-monthly — page geometry and document rules.
 * Spine: ../northmoor-shared.css. Accent policy (operational reports):
 * KPI keylines, grouped-section headers, one flagged result only. */
@page {
  size: Letter;
  margin: 52.5pt 57pt 40.5pt;
  @bottom-left {
    content: "Monthly operating report · August 2026";
    font-family: Helvetica, Arial, sans-serif;
    font-size: 5.625pt;
    letter-spacing: 0.14em;
    text-transform: uppercase;
    color: #8A857E;
  }
  @bottom-right {
    content: "Page " counter(page) " of " counter(pages);
    font-family: Helvetica, Arial, sans-serif;
    font-size: 5.625pt;
    letter-spacing: 0.14em;
    text-transform: uppercase;
    color: #8A857E;
  }
}
.sheet { position: relative; }
.atop { position: absolute; top: -52.5pt; left: -57pt; right: -57pt; height: 3pt; background-color: #7B2233; }
.kpigrid { display: grid; grid-template-columns: repeat(4, 1fr); gap: 18pt; margin-top: 19.5pt; }
.kpigrid-2 { margin-top: 18pt; }
.perf th.num { width: 61.5pt; }
.perf th.numw { width: 69pt; }
.bottomcols { display: flex; gap: 25.5pt; margin-top: 19.5pt; }
.commentary { width: 56%; }
.actions { width: 44%; }
.small-t { font-size: 6.75pt; }
northmoor-shared.css alongside them — the set’s shared spine (type scale, tables, signature blocks, the accent).
Sample data (data.json)
Sample data (data.json)
data.json
{
  "reference": "OPS-2026-08",
  "period": "August 2026",
  "month": "month 2 of FY2027",
  "kpis": [
    {
      "label": "Revenue, month",
      "value": 11204,
      "note": "$ thousand · plan 10,800 · +3.7% to plan"
    },
    {
      "label": "Gross margin",
      "value": "25.1%",
      "note": "Plan 24.6% · prior month 24.4%"
    },
    {
      "label": "On-time delivery",
      "value": "92.6%",
      "note": "Target 95.0% · 14 late lines of 189"
    },
    {
      "label": "Recordable injuries",
      "value": 0,
      "note": "62 days without a recordable injury"
    },
    {
      "label": "Order intake",
      "value": 12880,
      "note": "$ thousand · book to bill 1.15"
    },
    {
      "label": "Backlog",
      "value": 42.8,
      "note": "$ million · 4.9 months' cover"
    },
    {
      "label": "Scrap and rework",
      "value": "2.1%",
      "note": "Target 1.6% · driven by the 4471-B housings"
    },
    {
      "label": "Debtor days",
      "value": 47,
      "note": "Target 42 · one account 101 days overdue"
    }
  ],
  "performance": [
    [
      "Fabrication",
      4742,
      4600,
      142,
      9318,
      9100
    ],
    [
      "Piping and fittings",
      2918,
      2850,
      68,
      5704,
      5700
    ],
    [
      "Controls",
      1986,
      1750,
      236,
      3842,
      3500
    ],
    [
      "Service and maintenance",
      1558,
      1600,
      -42,
      3106,
      3200
    ],
    [
      "Revenue",
      11204,
      10800,
      404,
      21970,
      21500
    ],
    [
      "Gross profit",
      2812,
      2657,
      155,
      5438,
      5289
    ],
    [
      "Operating expenses",
      -1806,
      -1780,
      -26,
      -3588,
      -3560
    ],
    [
      "Operating income",
      1006,
      877,
      129,
      1850,
      1729
    ]
  ],
  "actions": [
    {
      "action": "Close freight dispute, INV-4102",
      "owner": "M. Okonjo",
      "due": "19 Sep"
    },
    {
      "action": "Requalify housing bore gauge",
      "owner": "P. Raghunathan",
      "due": "16 Oct"
    },
    {
      "action": "Recover two late lines, R-07",
      "owner": "R. Halloran",
      "due": "02 Oct"
    }
  ],
  "intercompanyEliminations": 118
}
MIT-licensed, free to copy — source on GitHub. Passes PDF/UA-1 validation (veraPDF) in CI; validation is a floor, not a certification.